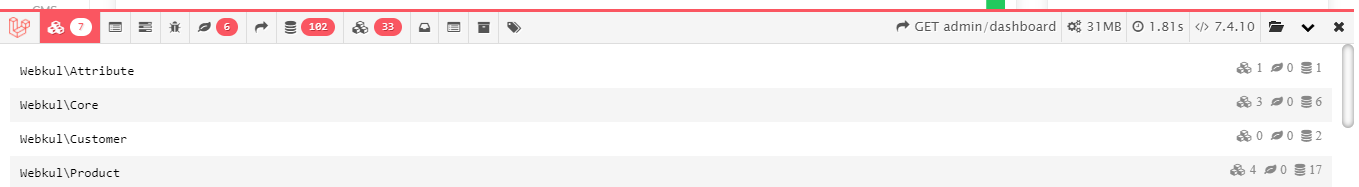
Laravel Debugbar is a popular package that provides a convenient way to debug and profile your Laravel applications during development. It adds a toolbar to your application’s UI, displaying useful information about the current request, database queries, executed queries, timing data, memory usage, and more. Here’s an overview of the features and benefits of using Laravel Debugbar:
1. Query Logging: Debugbar captures and displays all SQL queries executed during a request, including the number of queries, their execution time, and the stack trace. It helps you identify and optimize slow-running queries and avoid the N+1 query problem.
2. Route Information: You can view detailed information about the routes involved in the current request, including the route name, controller, and action. This can be handy for debugging routing issues and ensuring that your routes are correctly defined.
3. Request and Response Data: Debugbar displays information about the current request, including the HTTP method, headers, and payload. It also shows the response information, such as the HTTP status code and response time.
4. Timeline Profiling: The timeline feature of Debugbar allows you to profile different parts of your application’s code. It provides insights into the time taken by various operations, such as database queries, rendering views, and executing custom code. This helps you identify performance bottlenecks and optimize your application.
5. Memory Usage: Debugbar shows the memory usage of your application during the request, allowing you to monitor memory consumption and identify potential memory leaks or inefficiencies.
6. Log Viewer: It includes a log viewer that displays the contents of your application’s log files, making it easy to debug and analyze log entries without leaving your application’s interface.
7. Custom Messages and Timers: You can add custom debug messages and timers to your code using the Debugbar API. This feature is useful for tracking specific code execution points, measuring execution times, or displaying custom debugging information.
8. Integration with Other Libraries: Laravel Debugbar seamlessly integrates with other popular development tools and libraries, such as Laravel Telescope, allowing you to combine their features for a more comprehensive debugging experience.
To install Laravel Debugbar, you can use Composer by running the following command in your Laravel project:
bash : composer require barryvdh/laravel-debugbar –dev
After installation, you need to follow the package’s documentation to enable and configure Laravel Debugbar for your application.
Note that Debugbar is primarily intended for development environments and should not be used in production. Be cautious when enabling it and ensure it is only active in your local or staging environments.
For more information and detailed usage instructions, refer to the official Laravel Debugbar documentation: https://github.com/barryvdh/laravel-debugbar